
Most of the debate about the United States over the past eighteen months has been about visas: appointment backlogs, bond schedules, duration of status, travel restrictions. Those are all real, and they all sit at the end of the recruitment funnel.
The Common App figures released for the 2025-26 cycle describe something that happens much earlier, and is much harder to reverse. A tenth of the international students who would normally have applied to an American college simply did not apply. No consular officer was involved. No refusal was recorded. The decision was made before the application fee was paid.
Two Markets, One Platform
Common App is used by 1,146 US colleges and universities. The 2025-26 cycle covers applications submitted between 1 August 2025 and 28 July 2026. Within that single dataset, two populations moved in opposite directions.
First-year international applicants fell 10%. First-year US applicants rose 4%, which was enough to lift total applications on the platform by 2% across the cycle.
This is as close to a controlled experiment as international education ever gets. Same institutions, same admissions technology, same twelve months, same essay prompts. The only material difference between the two populations is that one of them needs a visa to take up the offer.
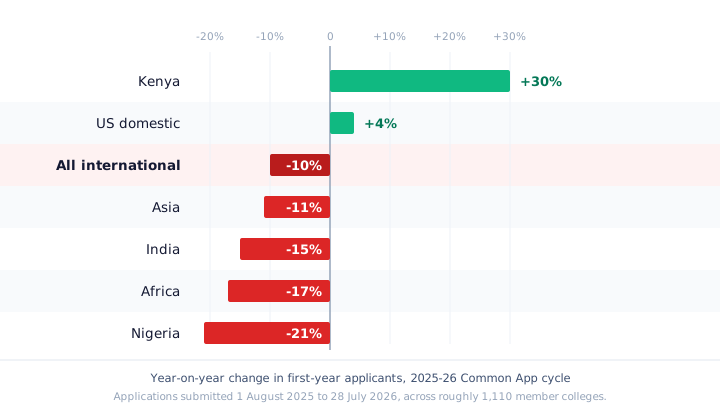
A 14-point divergence within one platform is difficult to explain with anything internal to American higher education. The academic offer did not change. The price did not change in a way that affects domestic and international families differently. What changed was the cost, the risk and the predictability of getting there.
The Decline Is Steepest Where the Volume Is
The fall is not a gentle, evenly spread softening. It is concentrated in exactly the markets that carry the most volume and the most visa exposure.
Nine of the ten largest source countries recorded year-on-year declines. Asia fell 11%, and India, the single largest source market for international students in the United States, fell 15%. Africa fell 17% overall, with Nigeria down 21%, the steepest drop among the top ten.
The exception matters as much as the rule. Kenya grew 30%, the only top-ten market to gain applicants during the cycle. Kenyan students faced the same federal policy environment as everyone else. What they did not face was the same consular throughput, the same agent and counsellor messaging, or the same accumulated national narrative about whether an American application is worth filing.
A visa refusal is a data point you can count. An application never submitted is not.
Latin America Held Its Ground
The one region that grew is the one closest to home. Common App recorded 19,170 first-year applicants from the Americas, up 5%, the only world region to gain applicants in the cycle. The figure includes Canada, which fell 13%, so applicants from Latin America and the Caribbean rose faster than the regional headline suggests. Common App does not publish the Latin American share or individual figures for Brazil, Mexico or Colombia.
Enrolment data fills part of that gap. According to IIE's Open Doors 2025, Latin America and the Caribbean sent 87,932 students to the United States in 2024/25, up 2%. The three largest senders all grew. Brazil, the tenth-largest source country, reached 17,277 students (+2.4%). Mexico reached 15,652 (+1.2%) and Colombia reached a record 10,213 (+0.9%).
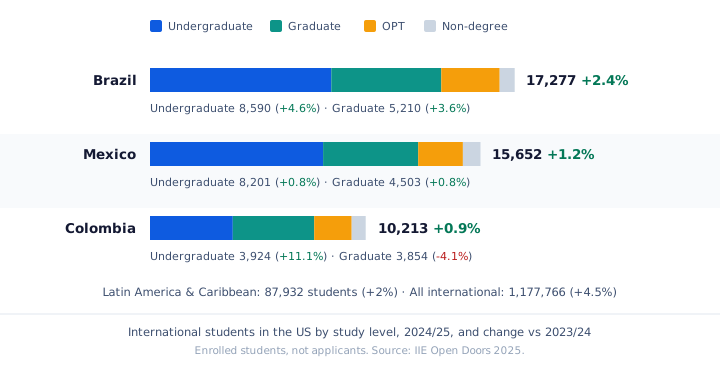
The growth is concentrated at undergraduate level, which is exactly the level Common App measures. Brazilian undergraduates rose 4.6% and Colombian undergraduates rose 11.1%, while Colombian graduate enrolment fell 4.1%. Brazil also ranks among the top priority undergraduate recruitment markets in the IIE Fall 2025 Snapshot, named by 39% of US institutions.
For recruitment teams, this is the second counter-proof alongside Kenya. Latin American families face the same visa rules as everyone else, yet their demand for American undergraduate study is still rising. Those are the markets where recruiting effort is still being rewarded.
Why the Application Number Beats the Enrolment Number
Enrolment figures are the number the sector quotes, and they are the number that arrives too late to act on. A student who enrolled in September 2026 chose the United States in late 2024 and applied in 2025. By the time the enrolment census is published, three recruitment cycles have already been committed.
Applications sit roughly twelve months ahead of that, and they carry a second signal that enrolment cannot. Submitting an application is cheap, requires no visa, no bond, no proof of funds and no interview. It is the lowest-commitment step in the entire process. When students stop taking even that step, the destination decision has already been made and lost.
That distinction has a practical consequence. Faster visa processing, more appointment slots, a favourable court ruling: each of those would help students who are already in the funnel. None of them recovers a student who never entered it. Rebuilding applicant volume takes a full cycle of counsellor, agent and family confidence, and by then the class of 2027 has enrolled somewhere else.
The Bill, Measured Three Ways
NAFSA and JB International modelled the economic consequence using the Institute of International Education's Spring 2026 Snapshot, a survey of 585 institutions that estimated a 9.5% fall in overall international enrolment for 2026-27.
That translates to roughly 110,000 fewer international students, US$3.4 billion in lost direct spending and more than 39,000 jobs.
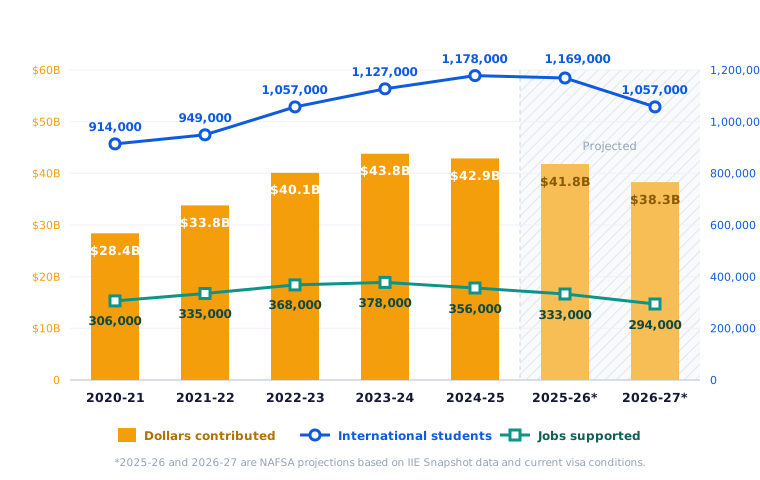
The three projected lines are the same event counted three different ways, and they reconcile precisely: enrolment falling from 1,169,000 to 1,057,000, contribution falling from US$41.8 billion to US$38.3 billion, and jobs supported falling from 333,000 to 294,000. The headline US$3.4 billion is not an advocacy estimate layered on top of the student number. It is the student number, priced.
The series also contains a detail that deserves more attention from recruitment teams than it usually gets. Total contribution peaked at US$43.8 billion in 2023-24, when enrolment was 1,127,000. The following year enrolment rose to a record 1,178,000, and contribution fell to US$42.9 billion. Average contribution per student dropped from roughly US$38,900 to US$36,400 in a single year, a fall of more than 6% while headcount grew.
In other words, the value of the cohort started eroding a full year before its size did. Headcount held up because the mix shifted toward lower-spending categories. Any institution measuring the health of its international programme on enrolment alone would have recorded 2024-25 as a record year.
Where the Loss Lands
NAFSA also modelled the projected loss state by state, which is the version of the number most likely to be useful in a conversation with a provost, a board or a state legislator.
| State | Projected loss, 2026-27 | Share of national total |
|---|---|---|
| California | US$499.6 million | 15% |
| New York | US$470.3 million | 14% |
| Massachusetts | US$284 million | 8% |
| Michigan | US$284 million | 8% |
| United States, total | US$3.4 billion | 100% |
Four states account for close to 45% of the projected national loss. That concentration is a function of where international students already study, and it means the political constituency for fixing this is narrower, and more identifiable, than a national figure suggests.
The Legal Front Is Now Open
The policy driving much of this is the Department of Homeland Security rule ending duration of status, the long-standing framework under which an international student was admitted for the length of their programme rather than a fixed date. Under the new rule, admission is capped at a fixed period, with four years the effective ceiling, from September.
In August 2026 a coalition of higher education associations and unions filed legal action against the rule. The claim is procedural rather than political: that DHS violated the Administrative Procedure Act by failing to adequately assess the rule's costs and benefits, failing to meaningfully respond to public comments, failing to consider less burdensome alternatives, and failing to justify the rule against its own stated objectives. It also alleges an inadequate public comment period and that DHS exceeded its statutory authority.
The coalition includes NAFSA: Association of International Educators; the Presidents' Alliance on Higher Education and Immigration; the Association of Independent Colleges and Universities in Massachusetts; the American Federation of Teachers; Graduate Labor Organization, AFT Local 6516; the International Union, UAW; UAW Local 2322; and the NewsGuild-CWA.
Ending Duration of Status and imposing new limits on academic decision-making is a solution in search of a problem. The rule will severely undermine the contributions international students make to US campuses, economies, and national security. After carefully reviewing the final rule and the sweeping harm it will cause to our national interest, it is clear that litigation is warranted and necessary.
Fanta Aw, Executive Director and CEO, NAFSA
Running alongside the litigation is a supply problem that no court will solve. A group of 30 US senators wrote to Secretary of State Marco Rubio about limited visa appointment availability for prospective international students at several US embassies, with expedite requests frequently denied. NAFSA cites interview delays as a critical factor in its own projection.
For recruitment teams the practical reading is uncomfortable: the 2026-27 cycle has to be marketed while its central rule is under active challenge. Whichever way the court goes, the message a family receives today includes the word "uncertain", and uncertainty is precisely what the Common App numbers show students pricing in.
Demand Did Not Vanish. It Was Reallocated.
The 4% rise in domestic applications is the control in this experiment, and it rules out the simplest explanation. American higher education did not become less attractive during the 2025-26 cycle. American students applied to it in greater numbers than the year before.
What fell was the willingness of international families to commit a year of planning to a destination whose entry rules were being rewritten mid-cycle. That is consistent with what we have tracked elsewhere over the same period: New Zealand recording its strongest month of student visa approvals since 2016, Greece approving new branch campuses of foreign universities, and agent surveys showing students actively widening their shortlists.
Kenya's 30% is the counter-proof. Where the pipeline was actively worked and the process was navigable, applications grew inside the same federal policy environment that produced a 21% fall in Nigeria. Policy sets the ceiling. Presence, information and process still determine where a market lands underneath it.
What Recruitment Teams Should Do This Cycle
- Benchmark your funnel against applications, not enrolment. If your international applications are down less than 10%, you gained share in a shrinking market. If they are down more, the market is not your problem.
- Move the visa conversation to the top of the funnel. Students are now making the destination decision before they apply. Answering process questions at offer stage is a cycle too late.
- Plan the calendar around interview availability, not the deposit deadline. Appointment scarcity in specific posts is now a scheduling constraint on your whole intake, and it varies enormously by country.
- Treat Kenya as a method, not an anomaly. One market grew by 30% under identical federal rules. Work out what was different there and whether it is reproducible in the markets that fell.
- Take the state-level number to your own leadership. "US$499.6 million from California" lands in a budget meeting in a way that "a 9.5% national decline" does not.
- Track contribution per student, not just headcount. The national data shows value falling a full year ahead of volume. Your own mix may already be telling you the same thing.
FPP Insight
The most quoted number of this cycle will be US$3.4 billion. The more important one is 10%.
The economic projection describes a loss that is already largely locked in, because the applications that would have prevented it were due in July. The applicant data describes the mechanism, and it points somewhere the sector has been slow to look: not at the consulate, but at the moment a seventeen-year-old and their family decide whether an American application is worth starting.
That decision is made on perceived predictability, and it is made twelve to eighteen months before anyone counts an enrolment. Nine of ten major markets answered no this year. One answered yes by 30%, under the same rules, which means the answer is not fixed.
For institutions and their recruitment partners, the work for the next eighteen months is upstream of everything the policy debate is currently about. The question is not how many students the United States will admit. It is how many will still think it is worth applying.