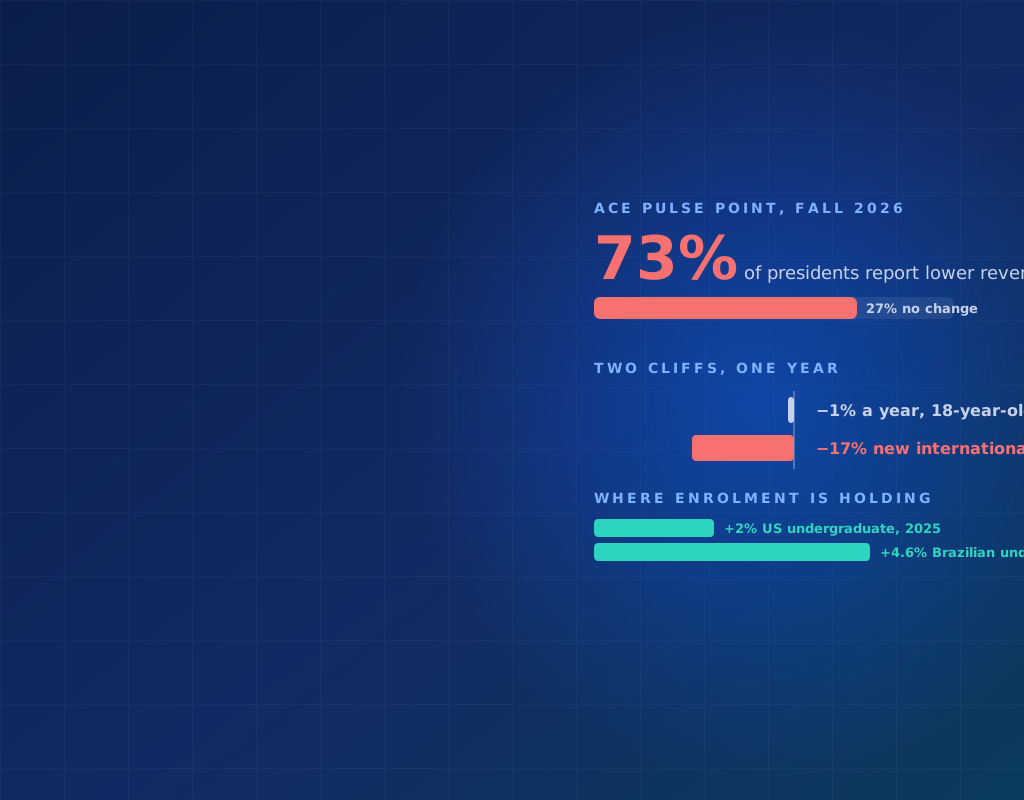
Every enrolment manager in the United States has a slide about the demographic cliff. The number of 18-year-olds peaks around now and then falls at roughly one percent a year, and institutions have had the better part of two decades to plan for it. Many have not, but at least the shape of the problem was known.
The second cliff had no warning slide. International enrolment in the United States set a record of 1,177,766 students in 2024/25. Within a year, new international enrolment was down 17%, graduate enrolment down 12%, and the first fall 2026 counts coming out of individual campuses suggest the drop this year is larger still. Mark Sklarow, the former head of the Independent Educational Consultants Association, called it "the other enrolment cliff" in late September. The phrase is useful because it names what makes this decline different: it is steep, it is fast, and it hits the budget line that paid for a great deal of what the campus does.
Two Cliffs, One Budget Meeting
The two declines look alike on a chart and behave differently in a budget. The demographic one is domestic, gradual and spread across every institution in a region. The international one is concentrated in the programmes that depended on it: the master's in computer science that filled with Indian students, the engineering department whose doctoral pipeline came from China, the business school whose margin came from full-fee undergraduates. When those students do not arrive, the gap does not show up as a slightly smaller first-year class. It shows up as a department that no longer covers its cost.
That is why the numbers below matter more than the enrolment figures you already know. They describe what the decline did to the institution, and they come from the people who sign off on your travel.
What the Presidents Told ACE
The American Council on Education surveyed 328 senior leaders in July 2026, among them 109 college and system presidents, and published the results on 9 September. The headline is the revenue line, and the rest of the table is what the revenue line did next.
| What leaders reported | Share | What it means in your budget request |
|---|---|---|
| Lower revenue because of the decline in international enrolment | 73% of presidents | The problem is owned by the president and the finance office now, not only by the international office. That is the audience for your 2027 plan. |
| Reductions in research or student support | 23% | Every department has felt the loss. Colleagues who never thought about recruitment now have a reason to support it. |
| Reduced institutional financial aid | 11% | Discounting is being cut. Recruitment that brings families who can pay the published price protects aid for everyone else. |
| Programme closures or mergers | 9% | Nearly one in ten institutions has already closed something. The cost of a missing cohort is not one year of tuition, it is a programme. |
| Extreme or moderate concern about immigration restrictions and visa revocations | 59% | Visa outcomes are now a board-level risk. Origins with low refusal rates are a risk-management argument, not a marketing preference. |
Set those figures beside the projections for this fall. NAFSA and JB International estimate that the United States could lose up to 111,000 international students in 2026/27, about 9.5% of the total, along with US$3.4 billion in spending and roughly 39,000 jobs. IIE's spring survey of 585 institutions found that 63% expected their international enrolment to fall and 59% had already received fewer applications. The final count arrives with the Fall 2026 Snapshot in November, but no institution is budgeting for a surprise on the upside.
A year ago the campus question was "what is happening to our international students?" This year it is "what happens to the institution if international enrolment does not hold?"
Why This Is Better News for a Recruiter Than It Sounds
It is an odd thing to say in a year of layoffs, but the ACE survey is the strongest argument an international recruiter has had in a long time. When three in four presidents attribute a revenue loss to your pipeline, the pipeline is no longer a cost centre with a travel budget. It is revenue protection, and revenue protection is a conversation the finance office understands.
The condition is that you bring the numbers the finance office uses, which are not the ones the international office usually reports. Fair attendance, leads collected and brand impressions do not appear in a revenue model. These five do.
- Revenue per enrolled international student, net of aid. For most US institutions that is the full published price, and for the programmes ACE's respondents are closing, it was the margin. Put the number next to the cost of a recruitment trip and the trip looks small.
- The four-year value of a cohort. A first-year student who does not arrive in 2027 is missing from the 2028, 2029 and 2030 budgets as well. A lost intake compounds, and so does a recovered one.
- Refusal rate by origin. State Department data reported by Inside Higher Ed puts F-1 refusals at 61% for India and 64% for Africa, against 22% for South America and 9% for Europe. A deposit from an origin that clears the consulate is worth more than three from one that does not, and the finance office can see that in the yield.
- Where enrolment is holding. US undergraduate enrolment grew 2% in fall 2025 while graduate fell 12%. Open Doors shows Latin America stable, and the Brazil fact sheet shows Brazilian undergraduates up 4.6% to 8,590. The money moved towards undergraduates from origins with low refusal rates, and that is where a recruiter can show a result.
- The deferral pool. Seventy-two percent of institutions offered deferrals to spring 2026 and 56% to fall 2026. Those students are already admitted. Converting them costs a fraction of finding new ones, and the conversion rate is a number you can report monthly.
The Month After Matriculation Is the Audit Month
Intead's advice to its clients this autumn is the right one: do not exhale when the fall class locks. The weeks right after matriculation are the only time of year when you can see exactly where commitments went soft, before next year's cycle buries the evidence. Their suggestion is a full-team review, with the data analyst and whoever lives in the CRM in the room, walking each stage of the funnel and asking what worked and where the yes went quiet.
Our addition is to run that review by source as well as by stage. The question a finance office will ask in the spring is not "where did we lose students?" but "which of the things we paid for produced the students we kept?" The table below is the one to build now, while the 2026 cohort is fresh.
| Checkpoint | What to count, by source | What a soft spot usually means |
|---|---|---|
| Enquiry to application | Share of leads from each event, platform or partner that submitted an application | Leads that were never qualified. A badge scan is not an enquiry. |
| Admit to deposit | Deposit rate by origin and by level | Price or aid expectation. For international families, often a funds gap discovered late. |
| Deposit to visa | Refusals by origin, with the stated reason | Financial documentation or an origin with a structural refusal rate. This is the line the board now reads. |
| Visa to arrival | Deferrals and no-shows, with the date of the last contact | Silence after the I-20. Admitted-student outreach stopped too early. |
| Arrival to second year | Retention of the international cohort by source | The number that proves a source delivered a student, not a registrant. |
When the table is filled in, each recruitment source has a cost per enrolled and retained student. That figure is the only one that survives a budget meeting in 2027, and it is also the one that tells you which events to keep.
Where the Students Went
In a conversation with Intead's Ben Waxman this month, IIE's chief executive Jason Czyz pointed to the places showing real growth while the big source countries fall: smaller, once-overlooked markets such as Cambodia, Romania and parts of Latin America. Whether that is a lasting shift or a moment is the open question, and the answer depends on which destination you ask.
For Canada the shift is already structural, and the window matters when quoting it. IRCC counted 65,240 new international student arrivals from January to August 2026 against 221,680 in the same eight months of 2024, a fall of 71%, and the year is tracking well below the government's own target of 155,000. The August figure alone jumped to 37,090 as the fall intake arrived, which is the seasonal pattern and the source of some "numbers are up" headlines; it was still 17% below August 2025 and 53% below August 2024. The stock of study permit holders stood at 602,115 at the end of August, down from a peak above one million in mid-2024, and Atlantic universities report 18% fewer international students for 2026/27. Since January, master's and doctoral students at public institutions are the one segment Ottawa actively wants. Everyone else who was planning an undergraduate degree in Canada has been re-routed, and Latin American families are among them.
Our read, from the families we meet at events in Brazil, Mexico and Colombia, is that this re-routed demand is going to three places: an American undergraduate degree where the family can show funds, a Spanish or Portuguese university where the price is a fraction, and a European master's two years later. The first of those is the one US institutions are already prioritising. In IIE's own survey, Brazil ranks third among the markets American institutions say they are working for undergraduates, after Vietnam and India and level with South Korea, and it does so with a refusal rate a third of India's.
Growth is not returning to the markets that fell. It is appearing in the markets that clear the consulate, and the finance office will notice which is which.
What This Means for Your 2027 Budget Request
- Write the request for the finance office, not the international office. Lead with revenue per student, the four-year value of a cohort and the ACE finding that 73% of presidents have already felt the loss. Your dean has read that survey.
- Report refusal rate as a financial risk. Put the origin mix of your pipeline next to the State Department refusal rates. If 60% of your deposits come from origins refused at 60%, say so and show the alternative.
- Finish the after-action review before the budget is set. The checkpoint table above, by source, gives every event and partner a cost per enrolled student. Approve 2027 trips on that number, not on where the team went last year.
- Work the admitted and deferred pool first. It is the cheapest enrolment on campus and the easiest to report.
- Ask every event for the share of registrants who clear the funds gate. Canada asks for C$23,448 in proof of funds and France for €877.50 a month; the United States asks for the I-20 figure. A registrant who cannot document it is a refusal waiting to be counted against you.
- Pitch the department, not only the university. With 9% of institutions closing or merging programmes, the chair of a department that lost its international intake is now an ally. Bring the plan to them.
- Treat Latin America as the undergraduate market it is. The region is stable in Open Doors, growing at undergraduate level, ranked third in institutions' own priorities and refused at 22%. For an American undergraduate programme that is the shortest route to an attributable enrolment in 2027.
FPP Insight
The demographic cliff gave the sector eighteen years and most of it was spent not planning. The international cliff gave it eighteen months, and the response has been faster because the loss is visible on this year's books. That visibility is the opportunity. A recruiter who walks into the budget meeting with the finance office's own numbers, revenue per student, refusal rate by origin, cost per enrolled student by source, is not asking for travel. They are presenting the institution's plan for replacing revenue that three in four presidents have already said is gone.
The plan has three parts, and every primary source this autumn points to the same three: concentrate on the level each destination is still admitting, weight outreach towards origins that clear the consulate, and measure every source by the students it enrolled and kept. Quality has a number now. In 2027 it is the only number that will get a trip approved.
We will publish IIE's Fall 2026 Snapshot and Open Doors 2026 as soon as they land in November, together with the Canadian 2027 cap. If the checkpoint table or the source figures behind this article would help your own planning, they are available on request.